If you use Google Analytics on your website, one of the many statistics that you can explore is where the visitors to your website come from.
To see where the visitors to your website come from in Google Analytics, open the Google Analytics property in question, then go to “Reports” > “Acquisition” > “Traffic acquisition.”
This tutorial will show you exactly how to access the “Traffic acquisition” report in Google Analytics, step by step and with screenshots. So if you’ve never done it before, read on below.
How to See Where Your Traffic Comes From in Google Analytics
Step 1: Fire up your favorite web browser and visit analytics.google.com.
Step 2: Log in to your Google account and open the Google Analytics property whose traffic sources you want to see.
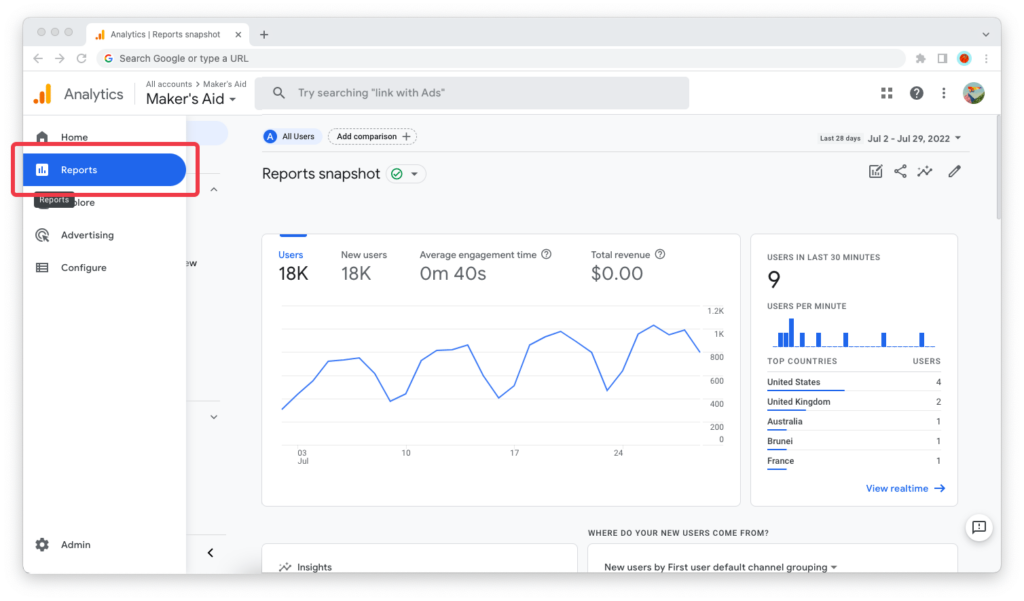
Step 3: Find the “Reports” tab in the sidebar. Click on it.

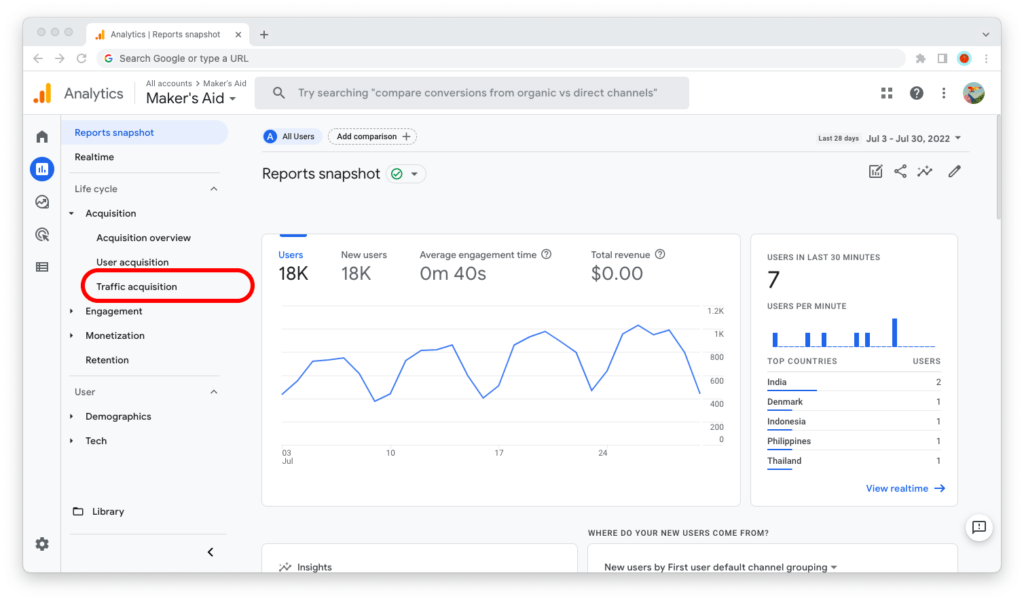
Step 4: Find the “Acquisition” topic in the “Life cycle” collection. Expand it and go to “Traffic acquisition.”

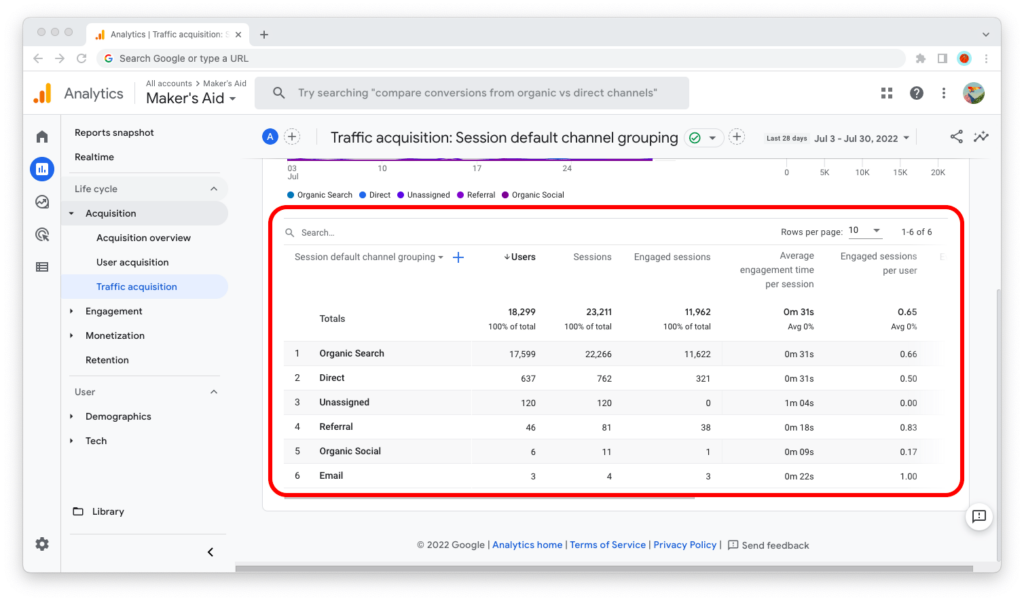
Step 5: This is the “Traffic acquisition” report in Google Analytics. Scroll down, and you will see a breakdown of your website’s traffic sources.

By default, Google Analytics shows you data for the last 28 days. You can adjust that by clicking on the date range in the upper-right corner of the browser window.
When it comes to the date ranges readily available in Google Analytics, some of your options are:
- Today
- Yesterday
- This calendar week or last calendar week
- Last 7 days
- Last 28 days
- Last 30 days
- Last 90 days
- Last 12 months
- This year
- Last calendar year
Of course, you can also set up custom date ranges.
Understanding the Traffic Acquisition Report
The traffic acquisition report in Google Analytics shows you data about where users and sessions on your website come from.
Traffic Sources
Generally, Google Analytics differentiates between seven traffic sources for your website: Direct, Paid, Organic Search, Social, Email, Referrer, and Other.
- Direct traffic is when a user types in the URL of your website in their browser’s address bar.
- Paid traffic is when a user lands on a page on your website from a paid traffic source, like Google Ads.
- Organic search traffic is when a user lands on a page on your website from a search engine, such as Google, Bing, or DuckDuckGo.
- Social traffic is when a user lands on a page on your website from a social media platform, like Facebook, Twitter, Instagram, YouTube, or TikTok.
- Email traffic is when a user lands on a page on your website from an email newsletter.
- Referrer traffic is when a user lands on a page on your website from a referring website, like a news outlet or a business directory.
- Other traffic is traffic that has a known acquisition source, but that source isn’t recognized by Google Analytics.
Users vs. Sessions vs. Page Views
What’s the difference between a user, a session, and a page view?
- A “user” is a single user who comes to your website.
- A “session” is a window of time during which that user engages with your website. If a user is inactive for more than 30 minutes, their future activity gets attributed to a new session.
- A “page view” is a single viewing of a page on your website by a user within a given session. A single session can have many page views, especially if you attract users who find your website engaging.
So, basically, one user can have many sessions, and each session can have one or more page views (check out how to see page views in Google Analytics).
Sessions vs. Engaged Sessions
If you look at the data in the traffic acquisition report, you will notice that Google Analytics makes a distinction between a session and an engaged session.
- A “session” is a window of time counted from the moment a visitor landed on a page of your website.
- An “engaged session” is a window of time counted from the moment a visitor:
- Spends at least 10 seconds on your website OR
- Has 1 or more conversion events OR
- Has 2 or more page views
The “Average engagement time per session” metric then gives you useful information about the average engagement time of users during sessions. The higher the time, the more engaging your website.
At any given time, your Google Analytics statistics will always show more sessions than engaged sessions.

